-
Beat on the Ground
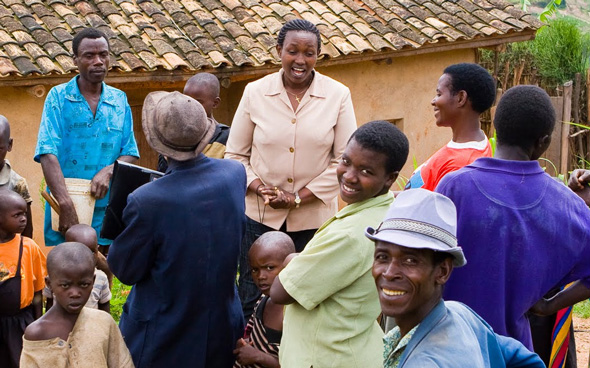
Reaching Rural Rwandans With Integrated Health and Livelihood Messages
MOREThis PHE Champion profile was produced by the BALANCED Project.
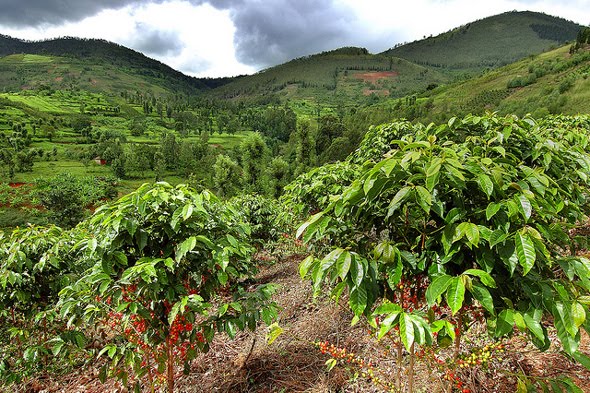
Rwanda is one of the most densely populated countries on the planet, with more than 11 million people in one of Africa’s smallest countries, most of whom depend on the land as subsistence farmers. The country has diverse mountain, lake, and savannah landscapes, and the Virunga Mountain chain in the northwest part of the country is home to one-third of the world’s threatened mountain gorilla population. At the same time, the population throughout the country suffers from high rates of unmet need for contraception, and three percent of the adult population lives with HIV/AIDS. In a land under such intense pressure on natural resources, rural livelihood initiatives are critical to ensuring people have options for meeting their daily health and well-being needs.
For the past three years, Jeanne Nyirakamana has served as head of the health program for the Sustaining Partnerships to Enhance Rural Enterprise and Agribusiness Development (SPREAD) Project. Supported by the U.S. Agency for International Development through Texas A&M; University, the SPREAD Project is integrating a dynamic coffee production and quality improvement program in Rwanda with health outreach to improve community well-being. The health component works to improve the lives of coffee farmers and cooperative members by providing them with health information and services related to family planning, maternal and child health, prevention of sexually-transmitted infections (including HIV), and water and sanitation.
Training Peer Educators
Working closely with the coffee program, Nyirakamana’s team has trained more than 540 men, women, and youth peer educators who have reached more than 95,000 coffee farmers with education and services. Key communication messages highlight the links between sound decision-making and health-seeking behaviors, productive farms and agribusinesses, and strong and healthy families.
The program also leverages and supports local health resources through referrals to existing public health services, organization of mobile clinics, and community-based distribution of a socially marketed water purification solution (Sur Eau) and condoms (Prudence). According to Nyirakamana, one of the project’s greatest successes is the increased acceptance of family planning by farmers and their families and the more than 7,500 farmers who have been tested for HIV. In order to draw in as many coffee farmers as possible, many of the health and livelihood activities take place at the stations where the coffee beans are washed, at other buildings used by the coffee farmer cooperative, or during combined community meetings or home visits. At the washing stations, Nyirakamana’s team supports local health center staff to provide voluntary counseling and testing (VCT) and de-worming services while at the same time SPREAD-trained peer educators and coffee/health extension agents disseminate family planning information.
The cooperatives’ buildings have clean water, hand-washing stations, and small kiosks where condoms and Sur Eau are sold. These community health agents work with SPREAD to ensure that the greater community, not just the coffee farmers, has access to health knowledge and services. They learn how to teach the community about a range of health issues and each month they submit reports showing how many people they reached and with what kinds of messages. They are also becoming increasingly engaged in coffee and agribusiness activities. Through the success of their health activities, these agents are seen as vital community resources.
Integrated Results
By implementing this integrated population, health and environment (PHE) approach, the SPREAD Project staff is ensuring the health of the people and environment and success of the agribusiness. “You cannot care for the environment without first caring for the people who live and use that environment, so when you transmit dual messages [agriculture and health] you are able to hit two birds with one stone,” said Nyirakamana.
According to a 2010 evaluation of the project, farmers and their families reported improvements in personal and household hygiene; an increase in understanding and acceptance of family planning; uptake of HIV and VCT services; and use of condoms and other local health services. As well, they noted shifts in gender norms affecting household revenue use, alcohol, and reproductive health. The agribusiness stakeholders value the integrated approach as a means to more holistically meet farmers’ goals of increased incomes and improved lives and livelihoods.
This PHE Champion profile was produced by the BALANCED Project. A PDF version can be downloaded from the PHE Toolkit. PHE Champion profiles highlight people working on the ground to improve health and conservation in areas where biodiversity is critically endangered.
Photo Credit: BALANCED Project. -
Guest Contributor
Book Review: ‘Plundered Nations? Successes and Failures in Natural Resource Extraction’
MOREThe principal argument of Plundered Nations? Successes and Failures in Natural Resource Extraction is highlighted by the question mark in the title. In many resource rich countries, natural assets have not led to development. The book advances the hypothesis that “for the depletion of natural assets to be converted into sustained development, a series of decisions has got to be got sufficiently right” (p. 1). That series of decisions is examined in detail through case studies on Cameroon, Chile, Iran, Kazakhstan, Malaysia, Nigeria, Russia, and Zambia, produced by a diverse group of academic and practicing economists under the auspices of the Center for the Study of African Economies and the Oxford Center for the Economics of Resource Rich Countries (OxCarre).
Topics: Africa, Brazil, conflict, development, economics, environment, Guest Contributor, minerals, natural resources, Nigeria, poverty, Russia, Tanzania, Uganda, video -
Watch: Geoff Dabelko on Climate Adaptation and Peacebuilding at SXSW
November 16, 2011 // By Wilson Center StaffMOREThe problems of climate adaptation, poverty alleviation, and peacebuilding are common to many parts of the world. Yet the efforts to address them are often pursued separately or with little coordination. Capturing the co-benefits of building institutional capacity critical to all three areas is an idea that will likely receive little attention at next year’s Rio+20 Earth Summit in Brazil, says ECSP Director Geoff Dabelko.
-
Friday Podcasts
Jotham Musinguzi on Investing in Family Planning for Development in Uganda
MORE“What we are seeing is not adequate, but we think we are seeing very good positive movement, and we want to build on that,” said Jotham Musinguzi, director of the African regional office for Partners in Population and Development (PPD) in Kampala, Uganda. Musinguzi is a public health physician by training who previously advised the government of Uganda on population and reproductive health issues. “We think that [the government] is now on a firm foundation to continue investing properly in family planning,” he said.
Family Planning for Development
Uganda’s high population growth rate (the country has a total fertility rate of 6.4 children per woman, according to the UN) presents a number of challenges, said Musinguzi, exerting pressure on education and health systems, as well as on basic infrastructure, particularly for housing and transportation. Additionally, high levels of poverty and unemployment can become a source of instability.
Policymakers in Uganda are beginning to recognize the urgency of the issue, however, particularly in regards to young people, said Musinguzi. “They don’t have access to jobs, they don’t have the skills, and therefore the challenges of poverty eradication become even more important.”
Nonetheless, the country’s contraceptive prevalence rate is low, at 24 percent, with 41 percent of married women expressing an unmet need for family planning services, according to the 2006 Demographic and Health Survey (DHS) for Uganda. Low levels of investment and lack of government involvement remain the primary obstacles, according to Musinguzi, in addition to socio-cultural and religious barriers.
Uganda historically depended primarily on donor finance, rather than government funding, to support family planning and reproductive health services, Musinguzi said. However, over the past two years, the Ugandan government has increased investment due to concerted efforts by PPD, as well as USAID, the UN Population Fund, and civil society groups. “Our point was that if the government does not fund family planning, then they are going to find that achievement of the Millennium Development Goals…is going to be very challenging,” he said.
“I think the low investment in family planning in Uganda is a thing of the past, and we are now looking forward to really better investment in this field,” Musinguzi said. “I am sure we are going to witness quite a big change [in the 2011 DHS] in terms of access as a result of the proper social investment that the government is trying to do now.”
South-South Collaboration
“I have a keen and strong interest in South-South collaboration in the field of reproductive health, family planning, population, and development,” Musinguzi said. Countries in the South have experience linking programming on population and development, and may face similar challenges, he said. For instance, Bangladesh and Vietnam had successful family planning programs that helped blunt rapid population growth rates.
“Countries, like Uganda, and others which haven’t gotten there yet, could learn from these other countries,” said Musinguzi, by sharing best practices and lesson learned, and replicating applicable solutions.
PPD also has a regional project reaching out to policymakers to increase commitment and accountability for family planning and reproductive health services. For instance, parliamentarians may not realize that they can play a significant role, but they have a unique function in providing government and budget oversight, Musinguzi said. Furthermore, they can create legal and administrative frameworks that prioritize family planning programs.
“We continue to make the case for more investment in family planning and reproductive health, but also making sure we hold leaders accountable, to show more commitment, and make sure they improve on the welfare of the people that they represent,” Musinguzi concluded.
The “Pop Audio” series is also available as podcasts on iTunes.
Sources: MEASURE DHS, UN Population Division.Topics: Bangladesh, development, family planning, Friday Podcasts, podcast, population, poverty, Uganda, Vietnam, youth -
From the Wilson Center
Healthy People, Healthy Ecosystems: Results From a Public-Private Partnership
MORE“A lot of people probably don’t think that an organization with a name like ‘World Wildlife Fund’ would have a program on population, health, and the environment,” said WWF’s Tom Dillon at the Wilson Center, but actually it is very natural. “Most of the people we work with are in rural areas, and they depend on their natural resources for their own livelihoods and for their own well-being. Of course, if you are in that situation, in order to be a steward of the environment, you’ve got to have the basics. You have got to have your own health.”
Dillon was joined by staff from WWF, as well as Scott Radloff, director of USAID’s Office of Population and Reproductive Health, and Conrad Person, director of corporate contributions at Johnson & Johnson, to talk about the results of a three-year partnership between USAID, WWF, and Johnson & Johnson. The joint effort, a formal Global Development Alliance, provided health and family planning services, clean water, and sanitation to communities in three of WWF’s priority conservation landscapes: The Salonga National Park in the Democratic Republic of Congo (DRC), the Lamu Archipelago in Kenya, and the Terai Arch Landscape in Nepal.
By creating an innovative public-private partnership that linked health objectives, particularly related to family planning and maternal and child health, to environmental and conservation activities, “this alliance was ahead of its time,” said Radloff.
Human Health Linked to Environmental Health
The project had four objectives, said Terri Lukas, WWF’s population, health, and environment (PHE) program manager: improve family health; reduce barriers to family planning and reproductive health services; improve community management of natural resources and habitat conservation; and document and promote successful approaches.
“Human health cannot be separated from environmental health anywhere,” Lukas said, “but most especially when we are working with very poor people who live very close to nature.”
Projects Provide Integrated Services
The Salonga National Park in the DRC is home to many endangered species, including the bonobo, one of the four great apes. Local communities are very isolated, and lack access to safe drinking water and sustainable livelihoods, as well as basic health and family planning services, according to Lukas. The PHE project was able to train 135 voluntary community health workers in family planning and maternal and child health care, including 55 women. One year after the training, health workers were distributing contraception to more than 300 new users per month, Lukas said.
The alliance has also integrated health and family planning services into conservation programs in Kenya’s Kiunga Marine National Reserve, in part, “to demonstrate to the people that we care about them as well as the environment, and also to show them the synergies that exist between the health issue and the environment issue,” said WWF Program Coordinator Bahati Mburah. The region has been suffering through a year-and-a-half-long drought, and has one of the highest population growth rates in east Africa, placing considerable pressure on natural resources.
“We talk to [the fisher folk] about health and family planning, and how they are related to the management of fisheries,” said Mburah. With improved transportation and mobile outreach services provided by the project, 97 percent of women are now able to access family planning services within two hours of their home, she said.
The third site is in the Terai region along the southern border of Nepal. In this lowland region, the alliance is attempting to safeguard and restore forest areas in order to allow wildlife to move and breed more freely, while at the same time improving the health and economic prospects of the people. By linking these goals, support for conservation efforts increased from 59 percent to 94 percent of households, with 85 percent attributing positive attitude changes to increased access to health services and safe drinking water, according to Bhaskar Bhattarai, project coordinator for WWF-Nepal.
Documenting and Promoting Successful Approaches
Cara Honzak, WWF’s senior technical advisor on population, health, and environment, said the global objective of the alliance was to document and promote successful PHE approaches. Comprehensive baseline and endline surveys provided critical evidence that integrated PHE programming increases family planning use in remote areas, improves conservation buy-in within communities, and leads to increased participation of women in community leadership and decision-making.
“We have played a key role in producing some of the evidence that has been used throughout Washington [D.C.], especially to provide information to government bodies that are making decisions about bringing more money into family planning, health, and particularly in the environmental sector,” said Honzak.
“After two decades in the field, and working in this area, I wasn’t expecting many surprises. I couldn’t have been more wrong,” Lukas said. “These three years have changed almost everything about the way I now view health development…I have long called myself a conservationist, but now I say to my international health colleagues: we are all conservationists, and if we aren’t, we should be.”
Event Resources- Bhaskar Bhattarai presentation
- Cara Honzak presentation
- Terri Lukas presentation
- Bahati Mburah presentation
- Photo gallery
- Video
Topics: conservation, DRC, environmental health, family planning, forests, From the Wilson Center, global health, Kenya, Nepal, PHE, population, USAID -
Eye On
Twin Challenges: Population and Climate Change in 2050
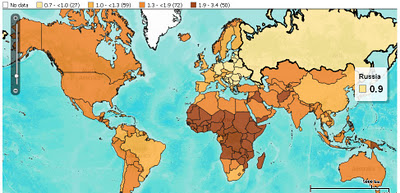
MOREWith global population reaching 7 billion, a lot of attention has been paid to the question of how to sustainably support so many people, much less the 9 billion expected by 2050, or the 10 billion possible by 2100. Add in the environmental variability projected from climate change and the outlook for supporting bigger and bigger populations gets even more problematic. Two new maps – one by the Population Reference Bureau (PRB), the other by McGill University PhD candidate Jason Samson – show how the world might change over the next 40 years in the face of these twin challenges.
Nine Billion in 2050
PRB’s map, built using their DataFinder tool, shows the world in 2050 in terms individual country growth rates between now and then. Japan, Russia, and countries in Eastern Europe are set to grow more slowly than anywhere else, and some of that group will actually shrink by 10 to 20 percent of their current size. Western, Central, and Eastern Africa will be home to the highest increases. Niger’s 2050 population is expected to be 340 percent its 2011 size – the largest growth of any country.
The map is based on country-level data pulled from a number of sources: the UN Population Division’s latest “World Population Prospects,” the UN Statistics Division’s “Demographic Yearbook 2008,” the U.S. Census Bureau’s International Database, and PRB’s own estimates. It’s unclear what numbers come from which sources, though it is clear that PRB’s 2050 estimates span the UN’s range of medium, high, and constant-fertility variants. In spite of these variations, none of PRB’s estimates come anywhere near the UN Population Division’s low variant estimates.
PRB’s map, echoing its 2011 World Population Data Sheet, shows a world where sub-Saharan Africa will bear the brunt of population growth. The average country in Africa in 2050 is projected to be slightly more than twice its 2011 size; the average European country is expected to barely break even. Africa is home to more countries whose populations are estimated to least double (34) or triple (4) than any other continent. Europe, meanwhile, is home to more countries whose populations will stagnate (8), or even shrink (19), than anywhere else. Interestingly, the Caribbean is a close second in terms of countries whose populations are projected to stay the same (seven to Europe’s eight), and Asia is second to Europe in terms of countries whose populations are projected to shrink (Georgia, Japan, Armenia, South Korea, and Taiwan).
More People, More Climate Change, More Vulnerability
Samson’s map takes on the same time period but projects where people will be most vulnerable to the effects of climate change. Since his map takes into account population growth (measuring where people are most vulnerable, remember), unsurprisingly, Africa, the Middle East, Southeast Asia, and central South America are covered in bright red dots, indicating high vulnerability. Conversely, North America, Europe, and much of Central Asia are in shades of blue.Samson built his index using four environmental predictors – annual mean temperature, mean temperature diurnal range, total annual precipitation, and precipitation seasonality – taken from WorldClim’s 2050 forecasts, and 2005 sub-national population data from Columbia’s Center for International Earth Science Information Network. In spite of the sub-national population data, Samson makes a point to justify his use of supranational climate data in order to best reflect “the scale at which climate conditions vary.” He writes that localized issues like urbanization and coastal flooding “are probably best investigated with targeted regional models rather than by attempting to modify global models to include all factors of potential regional importance.”
Samson’s research shows that, generally, people living in places that are already hot will be more vulnerable to climate change over time, while people in more temperate climates will feel a negligible impact. Though he projects the largest real temperature changes will happen in temperate climates like North America and Europe, the comparatively smaller changes in Africa, the Middle East, Southeast Asia, and central South America are expected to have a greater impact because those regions are already very hot, their natural resources are stressed, and they are expected to bear the brunt of population growth over the next few decades.
These findings reflect a disparity between those responsible for climate change and those bearing the brunt of it, which, although not surprising, “has important implications for climate adaptation and mitigation policies,” said Sampson, discussing the map in a McGill press release.
Sub-National Data “Present a Very Different Picture”
Though they offer a useful approximate glimpse at what the world might look at in 2050, both of these maps fall prey to over-aggregation. By looking at national rather than sub-national data, we miss how nuanced population growth rates can be within a country. Stimson Center Demographer-in-Residence Richard Cincotta wrote in a recent New Security Beat post that “national level comparisons of total fertility rates tend to communicate the false impression of a world with demographically homogeneous states.” Sub-national data, including differences between urban and rural areas and minority-majority fertility rates, “present a very different picture.”
And that difference matters. When it comes to looking at how population interacts with other issues, like the environment, poverty, and conflict, the importance of a sub-national approach becomes evident. In its 2011 data sheet, PRB writes that “poverty has emerged as a serious global issue, particularly because the most rapid population growth is occurring in the world’s poorest countries and, within many countries, in the poorest states and provinces.”Edward Carr, an assistant geography professor at the University of South Carolina currently serving as a AAAS science fellow with USAID, argues that national-level data obscures our ability to understand food insecurity as well. The factors that drive insecurity “tend to be determined locally,” writes Carr in a post on his blog, and “you cannot aggregate [those factors] at the national level and get a meaningful understanding of food insecurity – and certainly not actionable information.”
The same is true when it comes to climate vulnerability. In a report from The Robert S. Strauss Center’s Climate Change and African Political Stability Program, authors Joshua Busby, Todd Smith, and Kaiba White write that “research announcing that ‘Africa is vulnerable to climate change,’ or even ‘Ethiopia is vulnerable,’ without explaining which parts of Ethiopia are particularly vulnerable and why, is of limited value to the international policy community.”
“It is of even less use to Africans themselves, in helping them prioritize scarce resources,” add Busby et al.
Understanding the joint problems of climate change and population growth on a global level helps frame the challenges facing the world as it moves toward 8, 9, and possibly 10 billion. But knowing the ins and outs of how these issues interact on a local level will be a necessary step before policymakers and others can hope to craft meaningful responses that minimize our vulnerability to these challenges over the coming decades.
Sources: Center for International Earth Science Information Network at Columbia University, Climate Change and African Political Stability Program at the Robert S. Strauss Center, McGill University, Population Reference Bureau, UN Population Division, UN Statistics Division, U.S. Census Bureau, University of South Carolina, WorldClim.
Image Credit: “2050 Population As a Multiple of 2011,” courtesy of PRB; CDVI map used with permission, courtesy of McGill University; Sub-national total fertility rates in Southern Africa, courtesy of MEASURE DHS, arranged by Schuyler Null.Topics: Africa, Asia, climate change, demography, development, environment, Europe, Eye On, population, poverty, security, urbanization, USAID -
Rwanda: Dramatic Uptake in Contraceptive Use Spurs Unprecedented Fertility Decline
November 8, 2011 // By Elizabeth Leahy MadsenMOREWith over 400 people per square kilometer, the highest rate on the African mainland, population density is perhaps the most widely-discussed factor of Rwanda’s demography. Some scholars, notably Jared Diamond, have argued that it played a primary role in sparking the 1994 genocide through competition for land (although others present a more complex theory based in policies and governance).
-
Beat on the Ground
Coffee Farmer and Extension Manager Promotes Improved Health and Livelihoods in Rwandan Coffee Communities
MOREThis PHE Champion profile was produced by the BALANCED Project.
Mr. Pascal Gakwaya Kalisa has produced coffee in the densely populated country of Rwanda for the past nine years. A proud member of the 1,200 member Maraba Coffee Cooperative in Huye District in the Southern Province of Rwanda, Kalisa knows that a larger income alone does not ensure a better quality of life for his fellow coffee farmers and their families. He also knows that a successful coffee growing/exporting enterprise depends on preserving the fragile Rwandan soils, as well as on the health and well-being of farming families and communities. Therefore, Kalisa and other cooperative members treat the land and trees with a level of personal care that is necessary for optimum organic production and soil preservation.
Kalisa and the community have set up small, garden-sized coffee farms that are more productive than usual. Cooperative washing stations have enabled the small-scale farmers to improve product quality, and the cooperatives themselves are learning to negotiate better coffee prices with international buyers. Through such efforts and the support of many international donors and industry partners, Rwanda has become a producer of high quality specialty coffee since 2005, and its coffees are being marketed through renowned coffee roasters and importers in the United States, Europe, and Japan. In just six short years, Rwandan farmers have doubled their incomes and created 2,000 jobs, and the first renowned specialty coffee competition Cup of Excellence in Africa was held in Rwanda in 2008.
SPREAD: A Community Partnership
Recognizing the broad-based health, social, and economic needs of coffee farmers and their families in this part of East Africa, the U.S Agency for International Development initiated the Sustaining Partnerships to Enhance Rural Enterprise and Agribusiness Development project (SPREAD) to provide rural cooperatives and enterprises involved in high-value commodity chains with both appropriate technical assistance and access to health-related services and information. It is this combination of technical assistance and health-related outreach and services that has resulted in increased and sustained incomes and improved livelihoods.
Kalisa and other members of various cooperatives that SPREAD supports recognize that not only should farmers and their families preserve the land, but they must also preserve their own health in order to perform the labor needed to farm the crop that will produce the steady stream of high quality coffee upon which their livelihoods depend. Initiating community dialogues around issues such as protected sex, gender roles, and how coffee revenue is spent within households has also been crucial to project success among both youth and adults.
In his role as coffee zone coordinator for the SPREAD project, Kalisa works with coffee cooperatives to implement improved agricultural practices that improve the quality of their crop. This includes using cleaner environmental practices during coffee processing, such as introducing composting of coffee cherry pulp. Kalisa also helps disseminate integrated health and coffee messages through a weekly coffee talk-show produced by the National University of Rwanda’s Radio Salus, called Imbere Heza (“Bright Future”). In one show, for example, a man explained to a fellow farmer that to get good coffee cherries, he should thin his trees to renew his plantation.
Integrating Healthy Lives
Kalisa has also helped the SPREAD project’s health team deliver integrated messages on family planning, maternal and child health, alcohol, nutrition, gender issues, and the linkages between these. He uses examples such as the one about tree thinning to explain that families that space their children tend to be healthier, as they can plan the number of children to better fit with the financial and natural resources at hand.
Kalisa sees the benefits of using community agents to deliver integrated health, environment, and livelihood messages. This includes training extension agents to discuss environmental and human health issues in the context of coffee growing. Also, having coordinators from the coffee program and the health program go hand-in-hand to the field saves time, fuel, and other project costs. Kalisa believes that this campaign to educate coffee farmers and their families on the linkages between human health, a healthy environment, and strong livelihoods will lead to long-term change in their behavior, attitudes, and knowledge – change that will help them live better lives today and into the future.
This PHE Champion profile was produced by the BALANCED Project. A PDF version can be downloaded from the PHE Toolkit. PHE Champion profiles highlight people working on the ground to improve health and conservation in areas where biodiversity is critically endangered.
Photo Credit: “Rwanda photos 060,” courtesy of David Dewitt/counterculturecoffee.
 A Publication of the Stimson Center.