With global population reaching
7 billion,
a lot of attention has been paid to the question of how to sustainably support so many people, much less the
9 billion expected by 2050, or the
10 billion possible by 2100. Add in the environmental variability projected from climate change and the outlook for supporting bigger and bigger populations gets
even more problematic. Two new maps – one by the
Population Reference Bureau (PRB), the other by
McGill University PhD candidate
Jason Samson – show how the world might change over the next 40 years in the face of these
twin challenges.
Nine Billion in 2050
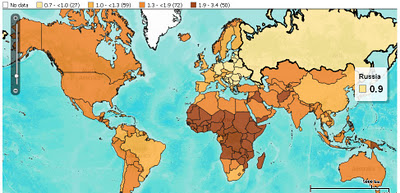
PRB’s map, built using their DataFinder tool, shows the world in 2050 in terms individual country growth rates between now and then. Japan, Russia, and countries in Eastern Europe are set to grow more slowly than anywhere else, and some of that group will actually shrink by 10 to 20 percent of their current size. Western, Central, and Eastern Africa will be home to the highest increases. Niger’s 2050 population is expected to be 340 percent its 2011 size – the largest growth of any country.
The map is based on country-level data pulled from a number of sources: the UN Population Division’s latest “World Population Prospects,” the UN Statistics Division’s “Demographic Yearbook 2008,” the U.S. Census Bureau’s International Database, and PRB’s own estimates. It’s unclear what numbers come from which sources, though it is clear that PRB’s 2050 estimates span the UN’s range of medium, high, and constant-fertility variants. In spite of these variations, none of PRB’s estimates come anywhere near the UN Population Division’s low variant estimates.
PRB’s map, echoing its 2011 World Population Data Sheet, shows a world where sub-Saharan Africa will bear the brunt of population growth. The average country in Africa in 2050 is projected to be slightly more than twice its 2011 size; the average European country is expected to barely break even. Africa is home to more countries whose populations are estimated to least double (34) or triple (4) than any other continent. Europe, meanwhile, is home to more countries whose populations will stagnate (8), or even shrink (19), than anywhere else. Interestingly, the Caribbean is a close second in terms of countries whose populations are projected to stay the same (seven to Europe’s eight), and Asia is second to Europe in terms of countries whose populations are projected to shrink (Georgia, Japan, Armenia, South Korea, and Taiwan).
More People, More Climate Change, More Vulnerability
Samson’s map takes on the same time period but projects where people will be most vulnerable to the effects of climate change. Since his map takes into account population growth (measuring where people are most vulnerable, remember), unsurprisingly, Africa, the Middle East, Southeast Asia, and central South America are covered in bright red dots, indicating high vulnerability. Conversely, North America, Europe, and much of Central Asia are in shades of blue.
Samson built his index using four environmental predictors – annual mean temperature, mean temperature diurnal range, total annual precipitation, and precipitation seasonality – taken from WorldClim’s 2050 forecasts, and 2005 sub-national population data from Columbia’s Center for International Earth Science Information Network. In spite of the sub-national population data, Samson makes a point to justify his use of supranational climate data in order to best reflect “the scale at which climate conditions vary.” He writes that localized issues like urbanization and coastal flooding “are probably best investigated with targeted regional models rather than by attempting to modify global models to include all factors of potential regional importance.”
Samson’s research shows that, generally, people living in places that are already hot will be more vulnerable to climate change over time, while people in more temperate climates will feel a negligible impact. Though he projects the largest real temperature changes will happen in temperate climates like North America and Europe, the comparatively smaller changes in Africa, the Middle East, Southeast Asia, and central South America are expected to have a greater impact because those regions are already very hot, their natural resources are stressed, and they are expected to bear the brunt of population growth over the next few decades.
These findings reflect a disparity between those responsible for climate change and those bearing the brunt of it, which, although not surprising, “has important implications for climate adaptation and mitigation policies,” said Sampson, discussing the map in a McGill press release.
Sub-National Data “Present a Very Different Picture”
Though they offer a useful approximate glimpse at what the world might look at in 2050, both of these maps fall prey to over-aggregation. By looking at national rather than sub-national data, we miss how nuanced population growth rates can be within a country. Stimson Center Demographer-in-Residence Richard Cincotta wrote in a recent New Security Beat post that “national level comparisons of total fertility rates tend to communicate the false impression of a world with demographically homogeneous states.” Sub-national data, including differences between urban and rural areas and minority-majority fertility rates, “present a very different picture.”
And that difference matters. When it comes to looking at how population interacts with other issues, like the environment, poverty, and conflict, the importance of a sub-national approach becomes evident. In its 2011 data sheet, PRB writes that “poverty has emerged as a serious global issue, particularly because the most rapid population growth is occurring in the world’s poorest countries and, within many countries, in the poorest states and provinces.”
Edward Carr, an assistant geography professor at the University of South Carolina currently serving as a AAAS science fellow with USAID, argues that national-level data obscures our ability to understand food insecurity as well. The factors that drive insecurity “tend to be determined locally,” writes Carr in a post on his blog, and “you cannot aggregate [those factors] at the national level and get a meaningful understanding of food insecurity – and certainly not actionable information.”
The same is true when it comes to climate vulnerability. In a report from The Robert S. Strauss Center’s Climate Change and African Political Stability Program, authors Joshua Busby, Todd Smith, and Kaiba White write that “research announcing that ‘Africa is vulnerable to climate change,’ or even ‘Ethiopia is vulnerable,’ without explaining which parts of Ethiopia are particularly vulnerable and why, is of limited value to the international policy community.”
“It is of even less use to Africans themselves, in helping them prioritize scarce resources,” add Busby et al.
Understanding the joint problems of climate change and population growth on a global level helps frame the challenges facing the world as it moves toward 8, 9, and possibly 10 billion. But knowing the ins and outs of how these issues interact on a local level will be a necessary step before policymakers and others can hope to craft meaningful responses that minimize our vulnerability to these challenges over the coming decades.
Sources: Center for International Earth Science Information Network at Columbia University, Climate Change and African Political Stability Program at the Robert S. Strauss Center, McGill University, Population Reference Bureau, UN Population Division, UN Statistics Division, U.S. Census Bureau, University of South Carolina, WorldClim.
Image Credit: “2050 Population As a Multiple of 2011,” courtesy of PRB; CDVI map used with permission, courtesy of McGill University; Sub-national total fertility rates in Southern Africa, courtesy of MEASURE DHS, arranged by Schuyler Null.
 A Publication of the Stimson Center.