-
Tracking the Energy Titans: Hidden Trends in the United States, China, and Canada [Infographic]
September 14, 2015 By David Rejeski
Back in high school physics we learned the first law of thermodynamics: Energy within a closed system must remain constant. In other words, the total amount of energy cannot increase or decrease without some sort of outside interference.
Back in high school physics we learned the first law of thermodynamics: Energy within a closed system must remain constant. In other words, the total amount of energy cannot increase or decrease without some sort of outside interference.
We tend to think of national energy systems as closed, but coal, natural gas, and other forms of energy flow within and between countries based on a complex mix of factors. How countries produce and use energy, how much energy they import and export, and how it is converted into transportation, heating/cooling, and the production of goods and services can vary widely.
The severity of the U.S. winter in northern states, for example, can have a major impact on how much hydropower Canada exports. Booming natural gas production in the United States, meanwhile, has contributed to a 40 percent decline in oil product imports since 2007. These flows, and the energy policies that guide them, are inexorably linked to geopolitical relationships, the global economy, environmental sustainability, and even national security.
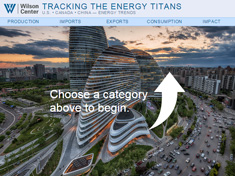
Booming natural gas production in the U.S. has contributed to a 40 percent decline in oil product imports since 2007To better understand our energy system, the Wilson Center has developed a new interactive infographic, “Tracking the Energy Titans.” Drawing on data for the United States, Canada, and China, users can compare national energy trends in consumption, production, imports, exports, and environmental impacts between three countries with important trade ties. We hope you take a few minutes to look around and explore the energy relationship between these countries.
Why focus on these particular “titans?” As major users and producers of energy, the United States and China were obvious choices. Canada provides an interesting case study of a major world energy producer with a much smaller population. The country is in the top 10 for production of natural gas, electricity, and petroleum, according to the U.S. Energy Information Administration. At the same time, Canadian energy production is inextricably linked with U.S. energy consumption, particularly for hydro-based power and petroleum. So while there are other major users and producers of energy, these three provide an interesting vantage point to better understand world energy flows.
The interactive also reveals the hidden truths that often lurk behind the headlines.
While the media focuses on China’s staggering levels of carbon dioxide emissions, the interactive shows that on a per capita basis, these emissions are actually quite low (but growing). And there is the looming issue of energy losses due to inefficiencies within the system. For example, nearly one-third of the energy produced in the United States in 2012 was lost because of inefficiencies in production and use. During the same period, China lost 18 percent of its produced energy while Canada only lost 7 percent.
This project is a collaboration of the Wilson Center’s China Environment Forum, Canada Institute, Environmental Change and Security Program, and Science and Technology Innovation Program, each of which brings a different perspective and unique expertise to the project.
This is just the beginning. New countries and data will be added to “Tracking the Energy Titans” to expand the conversation and spark new dialogues on energy use. Future blog posts will examine other energy titans, such as India’s energy demands, and other issues related to the international energy balance. We invite you to provide feedback and suggestions in the comments.
For more, visit NewSecurityBeat.org/EnergyTitans
David Rejeski is the director of the Science and Technology Innovation Program at the Wilson Center.
Sources: U.S. Energy Information Administration.
Topics: Asia, Canada, China, Choke Point, coal, consumption, economics, energy, environment, featured, From the Wilson Center, natural gas, oil, U.S.
 A Publication of the Stimson Center.