-
Regulating the Resource Curse: U.S. Adopts International Transparency Rules for Oil Industry
›
It’s not often that a change in accounting rules could reduce the probability of war. But that’s exactly what happened at the U.S. Securities and Exchange Commission (SEC) last month.
-
Nile Basin at a Turning Point as Political Changes Roil Balance of Power and Competing Demands Proliferate
›September 4, 2012 // By Carolyn Lamere
In 1979, Egyptian President Anwar Sadat famously said that “the only matter that could take Egypt to war again is water.” Sadat’s message was clear: the Nile is a matter of national security for Egypt.
Indeed, Egypt relies on the Nile for 95 percent of its water. But it is not the only state with an interest in the world’s longest river. There are 11 states in the Nile River basin, which stretches from Africa’s Great Lakes region – Tanzania, Uganda, Kenya, Rwanda, Burundi, and the Democratic Republic of the Congo – to the Ethiopian and Eritrean highlands through South Sudan, Sudan, and Egypt to the Mediterranean Sea.
-
As Urbanization Accelerates, Policymakers Face Integration Hurdles
›August 31, 2012 // By Blair A. RubleThe challenges for cities in the coming century will be many, but accounting for swelling numbers of new residents – due to more open avenues of communication and flows of goods, economic opportunity, population growth, and potential climate change-induced displacement – is perhaps the biggest.
-
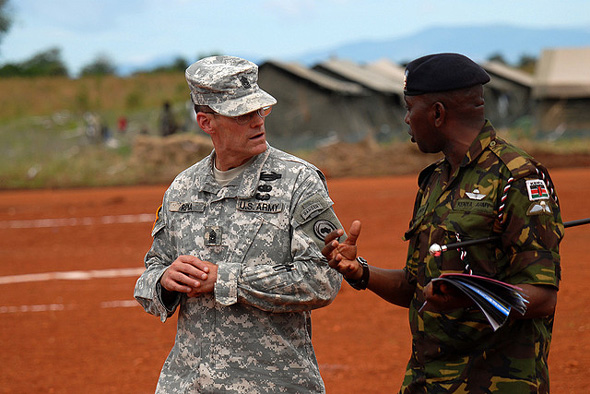
Should AFRICOM Leave Development to the Professionals?
›August 30, 2012 // By Schuyler NullSince its inception, there’s been a great deal of prognostication about the role and goals of the U.S. military’s newest regional command, AFRICOM. The smallest of the six regional commands, in terms of staff and budget, its objectives have included traditional roles like building local military capacities, confronting transnational threats (terrorism, weapons of mass destruction, small arms, drugs, etc.), and helping to mitigate violent conflicts, but also more development-oriented goals, like fighting HIV/AIDs and malaria, “strengthening democratic principles,” and “fostering the conditions that lead to a peaceful, stable, and economically strong Africa.”
-
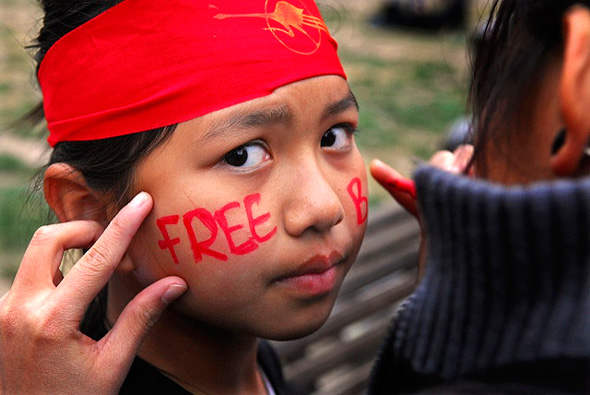
Coming of Age: Reason for Optimism in Burma’s Turn Towards Democracy
›Burma (also known as Myanmar), a country plagued by internal political turmoil and direct or tacit military rule since 1962, had its first general elections in 50 years in 2010 and long-time jailed opposition leader Aung San Suu Kyi won a seat in the National Assembly, but questions remain as to how much power the military is willing to cede. Demography provides reason for hope that this turn towards democracy is more than temporary.
-
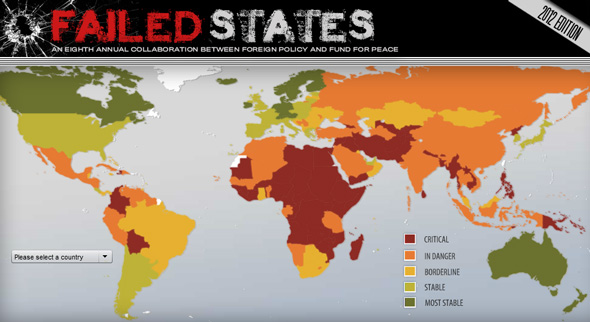
Another Year, Another Debate: Is the Failed States Index Simply Misnamed?
›Every year, there are mixed reactions over the rankings and the efficacy of the Fund for Peace’s Failed States Index (FSI), the eighth edition of which was released in June. But this year, the criticism seems especially intense.
“Failed means there is no way back. Failed means a binary division between those countries that are salvageable and those beyond redemption. It is a word reserved for marriages and exams. It does not belong in a pragmatic debate,” wrote Claire Leigh for The Guardian in June.
-
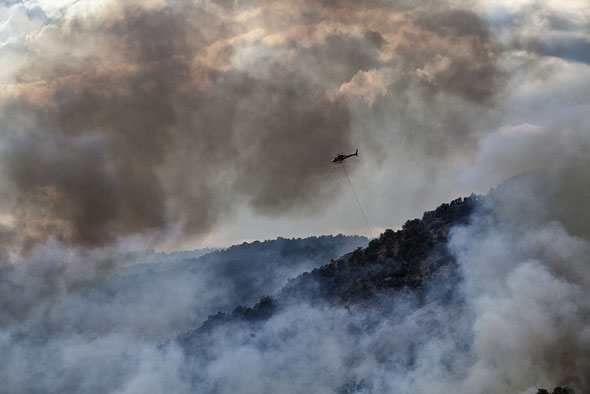
Linking Extreme Weather Events to Climate Change
›Specifically attributing a particular weather event to climate change has been difficult – as one famous analogy goes, it’s like determining which of Mark McGwire’s home runs were because of steroids and which weren’t. But climate attribution science is slowly becoming more accurate and accepted. In “Explaining Extreme Events of 2011 From a Climate Perspective,” a new study appearing in July’s Bulletin of the American Meteorological Society, editors Thomas C. Peterson, Peter A. Stott, and Stephanie Herring provide a review of six extreme weather events from last year and offer “some illustrations of a range of possible methodological approaches” to the process of attribution. Among their conclusions, the editors note that, due to climate change, the extreme heat and drought that suffocated Texas in 2011 was 20 times more likely to occur than 40 years earlier. However, the devastating floods that swept across Thailand last year are blamed on a number of other non-climatic factors.
-
Inside U.S. Climate Security Policy: Geoff Dabelko Interviewed by ISN
›August 20, 2012 // By Kate DiamondClimate change “has been thought of in many quarters as something that affects folks ‘over there,’ and not as much domestically, and I think that’s a mistake,” said ECSP’s Geoff Dabelko in a recent podcast with the Zurich-based International Relations and Security Network. “I think folks are coming to a realization that there are very high economic, political, and ultimately security stakes for the United States.”
Showing posts from category security.