-
Nile Basin at a Turning Point as Political Changes Roil Balance of Power and Competing Demands Proliferate
›September 4, 2012 // By Carolyn Lamere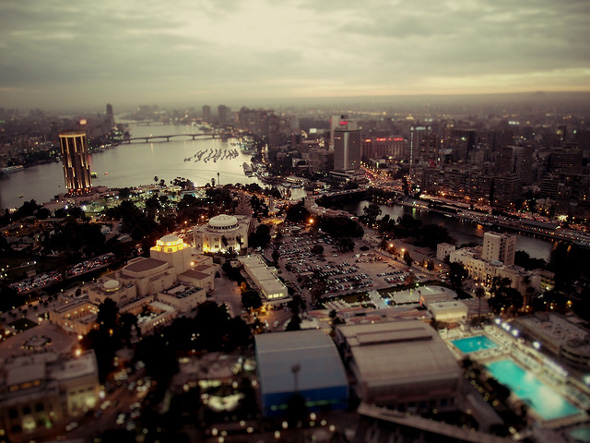
In 1979, Egyptian President Anwar Sadat famously said that “the only matter that could take Egypt to war again is water.” Sadat’s message was clear: the Nile is a matter of national security for Egypt.
Indeed, Egypt relies on the Nile for 95 percent of its water. But it is not the only state with an interest in the world’s longest river. There are 11 states in the Nile River basin, which stretches from Africa’s Great Lakes region – Tanzania, Uganda, Kenya, Rwanda, Burundi, and the Democratic Republic of the Congo – to the Ethiopian and Eritrean highlands through South Sudan, Sudan, and Egypt to the Mediterranean Sea.
-
Changing Cities: Climate, Youth, and Land Markets in Urban Areas
›The number of urban slum dwellers worldwide is staggering. According to UN-Habitat, 827.6 million people live in slums around the world. Despite meeting a Millennium Development Goal to significantly improve the lives of at least 100 million slum dwellers by 2020, the total number of people living in these areas still increased by 55 million between 2000 and 2010. By 2020, the world slum population is projected to reach 889 million. With the majority of people now living in cities, urban priorities are synonymous with human security and environmental sustainability and must be accounted for in the global development agenda.
-
As Urbanization Accelerates, Policymakers Face Integration Hurdles
›August 31, 2012 // By Blair A. Ruble
The challenges for cities in the coming century will be many, but accounting for swelling numbers of new residents – due to more open avenues of communication and flows of goods, economic opportunity, population growth, and potential climate change-induced displacement – is perhaps the biggest.
-
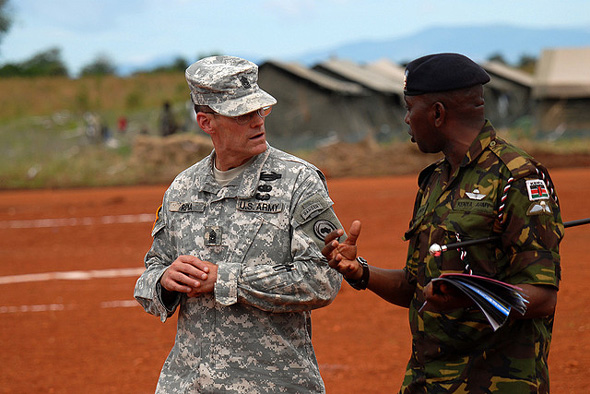
Should AFRICOM Leave Development to the Professionals?
›August 30, 2012 // By Schuyler NullSince its inception, there’s been a great deal of prognostication about the role and goals of the U.S. military’s newest regional command, AFRICOM. The smallest of the six regional commands, in terms of staff and budget, its objectives have included traditional roles like building local military capacities, confronting transnational threats (terrorism, weapons of mass destruction, small arms, drugs, etc.), and helping to mitigate violent conflicts, but also more development-oriented goals, like fighting HIV/AIDs and malaria, “strengthening democratic principles,” and “fostering the conditions that lead to a peaceful, stable, and economically strong Africa.”
-
Geoff Dabelko on the Evolution of Integrated Development and PHE
›August 27, 2012 // By Schuyler Null“Population-health-environment [PHE] connections have really been a focus of ours here at the Wilson Center for the last 15 years,” said outgoing ECSP Director Geoff Dabelko in an interview at the Wilson Center. The goal of ECSP’s project – HELPS (health, environment, livelihoods, population, and security) – is “really trying to understand these issues together.”
-
Resource Revolution: Supplying a Growing World in the Face of Scarcity and Volatility
›August 24, 2012 // By Kate DiamondOver the next two decades, as many as three billion people will join the middle class, even as billions more live without electricity, modern cooking fuel, and safe and reliable access to food and water. Resources are becoming more scarce and more difficult to extract, and combined with environmental factors ranging from climate change to soil erosion, those changes will make meeting middle class demand all the more difficult while leaving the world’s poorest more vulnerable to price shocks and resource shortages. In a recent report, the McKinsey Global Institute concludes that nothing less than a “step change” in how resources are managed will be required if individuals, businesses, and governments are to overcome these trends and pave the way for a more sustainable and equitable future.
-
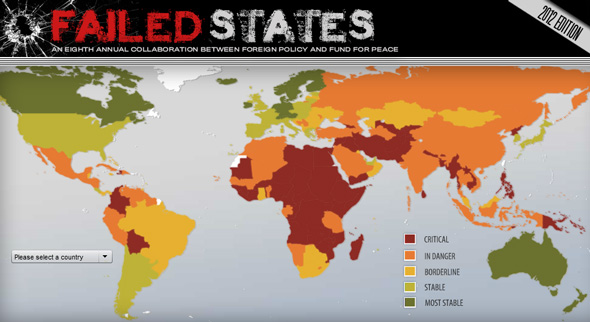
Another Year, Another Debate: Is the Failed States Index Simply Misnamed?
›Every year, there are mixed reactions over the rankings and the efficacy of the Fund for Peace’s Failed States Index (FSI), the eighth edition of which was released in June. But this year, the criticism seems especially intense.
“Failed means there is no way back. Failed means a binary division between those countries that are salvageable and those beyond redemption. It is a word reserved for marriages and exams. It does not belong in a pragmatic debate,” wrote Claire Leigh for The Guardian in June.
-
The Economist
In Poor Countries, Is Lower Fertility Bad for Equality?
›August 23, 2012 // By Wilson Center StaffThe original version of this article appeared on The Economist.
Economies benefit when people start having smaller families. As fertility falls, the share of working-age adults in the population creeps up, laying the foundation for the so-called “demographic dividend.” With fewer children, parents invest more in each child’s education, increasing human capital. People tend to save more for their retirement, so more money is available for investment. And women take paid jobs, boosting the size of the workforce. All this is good for economic growth and household income. A recent National Bureau of Economic Research study estimated that a decrease of Nigeria’s fertility rate by one child per woman would boost GDP per head by 13 percent over 20 years. But not every consequence of lower fertility is peachy. A new study by researchers at the Harvard School of Public Health identifies another and surprising effect: higher inequality in the short term.
Showing posts from category development.