-
Sharon Guynup, Mongabay
2022: Another consequential year for the melting Arctic
September 27, 2022 By Wilson Center Staff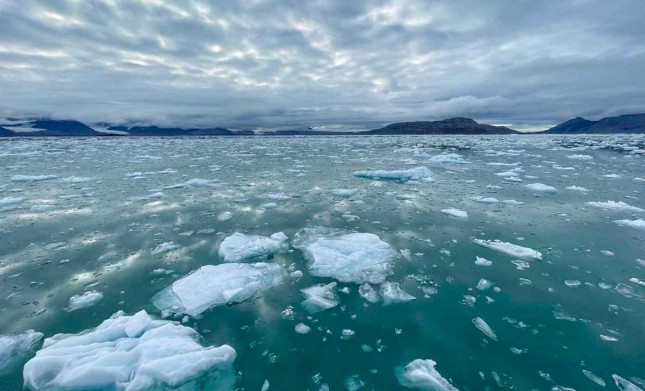 This article, by Sharon Guynup, originally appeared on Mongabay.
In August, I traveled aboard the icebreaker Kinfish to the Svalbard archipelago, north of the Arctic Circle. Invited to the bridge as we cruised fjords near the 80th parallel, I was transfixed by towering blue glacier walls, but was confused by the map displayed on one of the ship’s screens. It showed our vessel sailing across a non-navigable frozen sheet.
When I shared this story with Walt Meier, a senior research scientist at the National Snow and Ice Data Center, he didn’t seem surprised. “Things change fast there nowadays,” he said. So quickly, even polar ice mapping can’t keep pace.
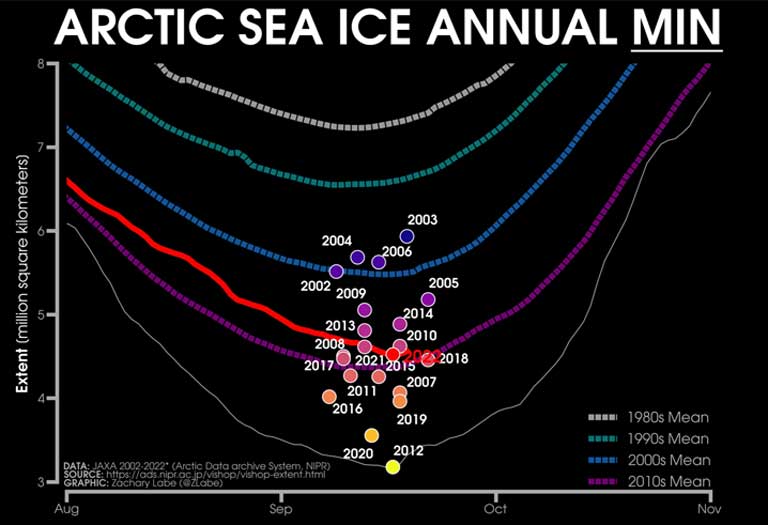
The 2022 spring/summer Arctic melt season, when the sun never sets and sea ice retreats, has now ended as the days quickly shorten, with the Far North heading back to full winter darkness. It wasn’t a record-breaking or news-making year for low ice extent — it ranked tenth, tying with 2017 and 2018 — but it has been yet another consequential melt season.

The last 16 consecutive years have been the lowest since 1979 when satellite tracking began, with the all-time low in 2012, says Zachary Labe, a postdoctoral researcher at Princeton University, and at the National Oceanic and Atmospheric Administration’s (NOAA) Geophysical Fluid Dynamics Laboratory. Overall, climate change is warming the Arctic nearly four times faster than the rest of the planet. But melt is not equal across the Arctic. The biggest overall factors impacting sea ice are air and sea temperatures, with winds and storms sometimes adding collateral damage.
Across much of the planet, it was a burning hot summer, with record-breaking heatwaves from Hong Kong and India to much of Europe, and the U.S. — and on top of the world as well. Air temperatures over “a good chunk of the Arctic” exceeded the 30-year average, says Meier. Unprecedented heat in Greenland during September, up to 36° degrees F. (20 degrees C.) above normal, helped slightly prolong the melt season: the average sea ice nadir is September 14; it came this year on September 18.
Back in July, Canada’s Northwest Territories broiled under extreme temperatures, which soared into the 90s, breaking all-time highs. That record warmth created countless melt ponds on Beaufort Sea ice, closely watched by scientists because it has retained substantial amounts of “old” thick ice, which is more resistant to melt. Those melt ponds erode ice from above.
Lead Image Credit: Open ocean with some floating ice in August 2022 off of Svarlbard in the Arctic. Image by Sharon Guynup.
Secondary Image Credit: Latest daily Arctic sea ice extent (JAXA AMSR2) for 2022 (thick red line). Mean sea ice extents from the 1980s, 1990s, 2000s, and 2010s decades are also shown by the dashed lines. A thin white line is shown for 2012. Yearly minimum extents (2002-2021) are shown by the scatter points with color in reference to the total sea ice extent. Image courtesy of Zachary Labe/Princeton/NOAA GFDL.
 A Publication of the Stimson Center.